

Profile Execution in UiPath Studio
Introduction
As automation projects scale in complexity, ensuring optimal performance becomes critical. Profile execution is a feature designed to address this need by enabling developers to:
– Measure execution times of activities.
– Analyze resource utilization.
– Identify performance bottlenecks.
This capability is especially valuable for large workflows or processes running in production environments, where even minor inefficiencies can lead to significant delays or resource wastage.
Key Features of Profile Execution
- Execution Timing: Provides precise timing for each activity, allowing developers to pinpoint slow-running steps.
- Resource Usage Monitoring: Tracks CPU and memory consumption during execution, offering insights into resource-heavy activities.
- Customizable Reports: Generates detailed execution logs and performance reports that can be shared with stakeholders.
- Real-Time Insights: Enables live monitoring of workflows to observe performance during development and testing.
How to Enable Profile Execution
To use profile execution in UiPath Studio, follow these steps:
1. Open UiPath Studio:
– Ensure you are using a version of UiPath Studio that supports profiling (2022.10 or later).
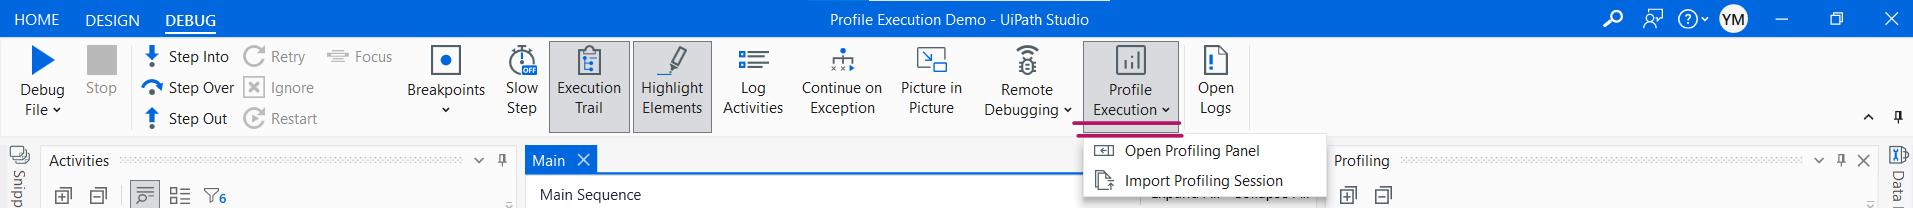
2. Enable Profiling:
– Navigate to the Debug tab.
– Click on the Profile Execution button to activate profiling mode.
3. Run the Workflow:
– Execute the workflow in Debug mode. The profiler will automatically start capturing performance data.
4. Analyze Results:
– After execution, review the profiling results in the Output Panel or export the logs for further analysis.
Workflow Execution:
Simple Workflow to Demonstrate Profile Execution Benefits
This workflow demonstrates the benefits of Profile Execution in UiPath by processing a list of numbers and identifying performance bottlenecks. It initializes a list, processes each number with operations like addition and logging, and introduces an artificial delay to mimic a bottleneck.
By enabling Profile Execution in Debug mode, users can analyze execution time and resource usage in the Output Panel.
The insights help optimize the workflow by removing delays or improving loop logic, showcasing how Profile Execution aids in enhancing performance.
Observation results:
1. Result with Delay Bottleneck
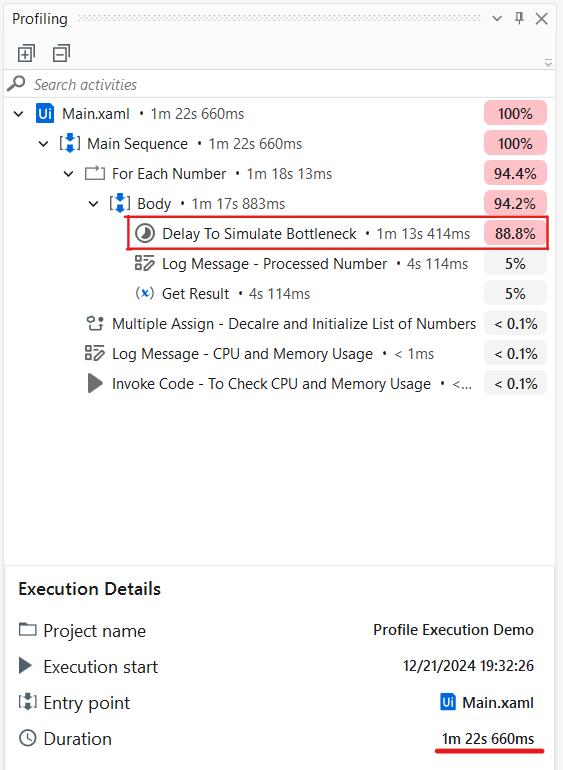
Profiling Result with Delay Bottleneck
The total execution time was 1 minute, 22 seconds, and 660 milliseconds, with 88.8% of the time consumed by the delay bottleneck.
Output result with delay bottleneck:
See content credentials
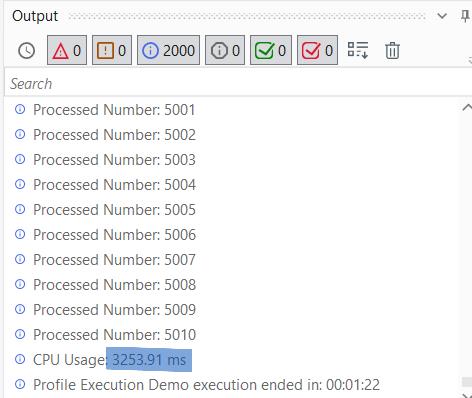
Output Result with Delay Bottleneck
Based on this observation, the delay bottleneck was eliminated from the workflow to decrease the total execution time.
2. Results after removing the delay bottleneck
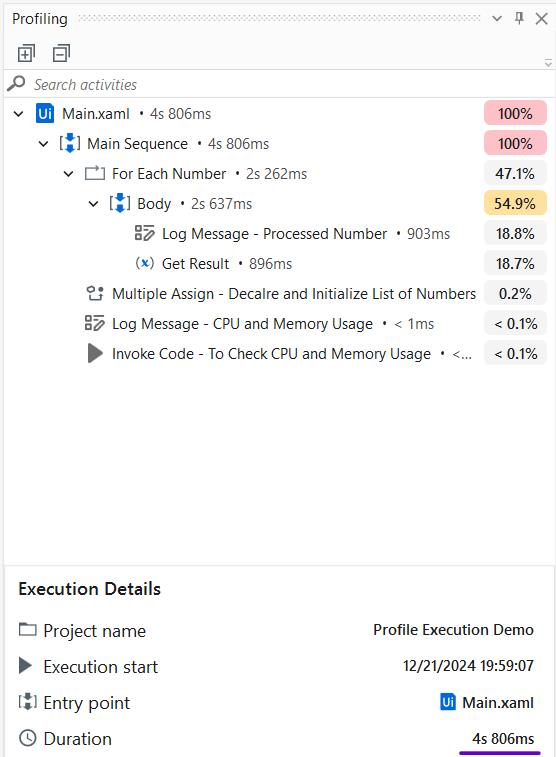
Profiling Result after Removing Delay Bottleneck
After eliminating the delay bottleneck, the total execution time significantly decreased to 4 seconds and 806 milliseconds, demonstrating the impact of optimization on workflow performance.
Output result after removing the delay bottleneck:
See content credentials
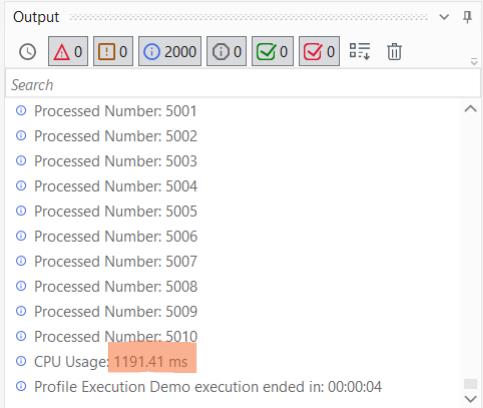
Output Result after Removing Delay
- Note: The delay here symbolizes a bottleneck, which could be specific activities, sequences, or workflows consuming most of the execution time. These can be identified and optimized using insights from Profile Execution observations.
Impact of Profile Execution
- Bottleneck Identification: Pinpoints the exact activity causing delays (e.g., the Delay activity in this case).
- Performance Monitoring: Provides execution time and resource usage metrics for each activity.
- Optimization Validation: Confirms that removing the bottleneck reduces overall execution time and improves efficiency.
This simple workflow illustrates how Profile Execution helps debug and monitor processes, ensuring that even small inefficiencies are identified and resolved for smoother automation.
Real Life Scenario Delay which can be identified by profile execution
In the context of Profile Execution in UiPath, delays often represent real-world inefficiencies or bottlenecks that consume unnecessary time during automation. Here’s how such delays manifest in real scenarios and how Profile Execution helps identify and resolve them:
1. Data Processing Bottlenecks
- Scenario: Processing large datasets, such as reading Excel files with thousands of rows or applying complex transformations.
- Delay Cause: Inefficient use of activities like nested loops or excessive filtering operations.
- Profile Execution Insight: Shows that specific activities (e.g., For Each Row or Filter Data Table) consume excessive execution time. Helps pinpoint the exact step where processing slows down.
2. Interaction with External Systems
- Scenario: Integrating with APIs, databases, or web services that have latency issues.
- Delay Cause: Long response times or redundant calls to external systems.
- Profile Execution Insight: Highlights activities like HTTP Request or Database Query taking disproportionately long. Helps determine if retries or unnecessary calls are inflating execution time.
3. File Operations
- Scenario: Automating workflows that involve handling large files, such as PDFs or CSVs.
- Delay Cause: Inefficient file reading, parsing, or writing operations.
- Profile Execution Insight: Identifies which file-related activities (e.g., Read PDF Text, Write Range) are causing delays. Suggests areas where optimization (e.g., reading in chunks or using efficient libraries) is needed.
4. UI Automation on Slow Applications
- Scenario: Automating legacy or virtualized applications (e.g., Citrix, Remote Desktop).
- Delay Cause: Slow rendering of UI elements or unreliable selectors causing retries.
- Profile Execution Insight: Pinpoints time-consuming UI interactions, such as Click or Type Into. Highlights activities with long execution times, indicating the need for better selector strategies or using technologies like UiPath Remote Runtime.
5. Redundant or Unnecessary Activities
- Scenario: Workflows with redundant logging, delays, or loops.
- Delay Cause: Overuse of activities like Log Message, unnecessary Delay, or poorly designed loops.
- Profile Execution Insight: Shows the cumulative time spent on repetitive or redundant activities. Encourages optimization by removing or consolidating unnecessary steps.
Conclusion
Profile execution in UiPath Studio is an essential tool for RPA developers aiming to build high-performance workflows. By providing actionable insights into execution times and resource usage, it empowers developers to optimize their automations and deliver robust solutions for enterprise environments. Incorporating profile execution into your development process ensures that your workflows are not only functional but also efficient and scalable.


