

BIP Report Generation
What is a BI Report?
A BI report is a structured document that presents data in an organized manner, enabling stakeholders to analyze performance, trends, and key metrics. These reports are generated using BI tools like Tableau, Power BI, and Google Data Studio, which extract data from multiple sources and visualize it through charts, graphs, and dashboards.
Types of BI Reports
BI reports come in various formats, each serving a specific purpose:
- Operational Reports – Provide real-time data on daily activities, such as sales and inventory levels.
- Analytical Reports – Offer deeper insights into historical data, helping businesses identify patterns and make strategic decisions.
- Dashboards – Present a visual summary of key performance indicators (KPIs) in a concise and interactive format.
- Ad Hoc Reports – Allow users to create customized reports tailored to specific business queries.
- Financial Reports – Focus on revenue, expenses, profit margins, and other financial metrics.
Benefits of BI Reports
1. Improved Decision-Making
BI reports provide accurate, real-time data, enabling managers to make well-informed decisions.
2. Enhanced Operational Efficiency
By identifying inefficiencies and bottlenecks, BI reports help organizations streamline their processes.
3. Better Forecasting
With historical data analysis, businesses can predict trends and plan for future growth effectively.
4. Increased Productivity
Automated reporting reduces manual data entry and analysis, allowing employees to focus on strategic tasks.
5. Competitive Advantage
Data-driven insights give companies a competitive edge by identifying market trends and customer preferences before their competitors do.
Steps to create BI Reports
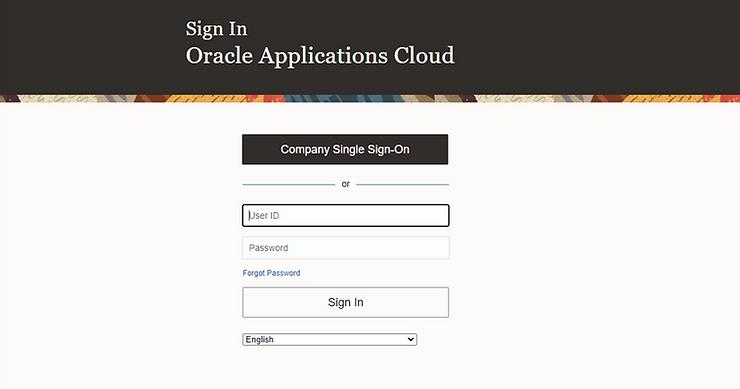
- Go to the oracle login page and fill the id and password then sign in.
- From the Home page, access Tools tab and go to the Reports and Analytics.
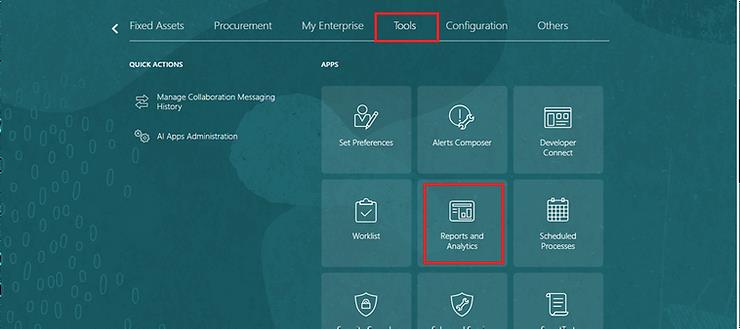
- Click on Reports and analytics.
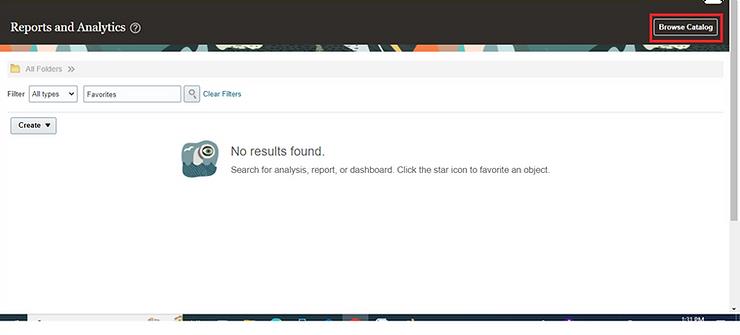
- Click On Browse catalog and click on.
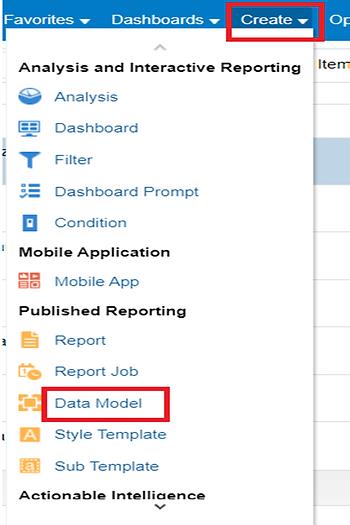
- Click on Drop-down buttonCreate and selectData Model.
- On the Diagram tab, click on (+) and select SQL Query.
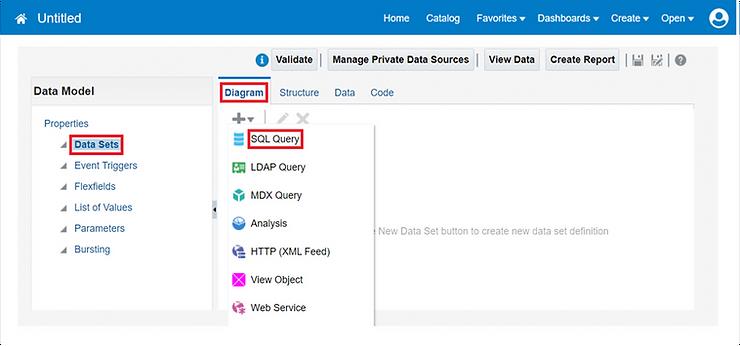
- In the New Data Set window:
Name: enter a name for the query
Data Source: Application DB_HCM
Type of SQL: Standard SQL
- Write a query into the SQL Query box.
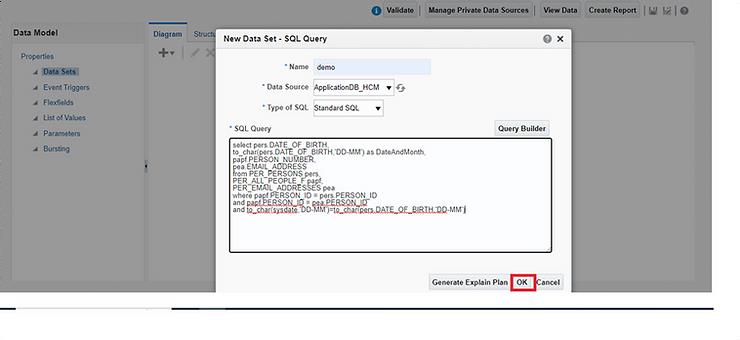
- Click on OK Button, to exit the New Data Set window.
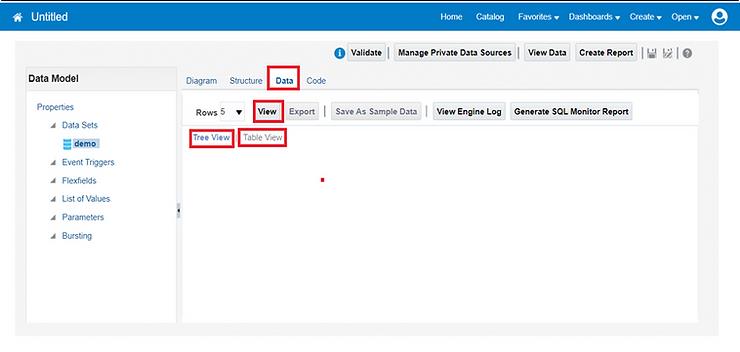
- Select the Data tab.
- Drop-down on Rows to increase the number of results returned.
- Select the View button.
- The results will default to Tree View for the XML; select Table View to see the results in table format.
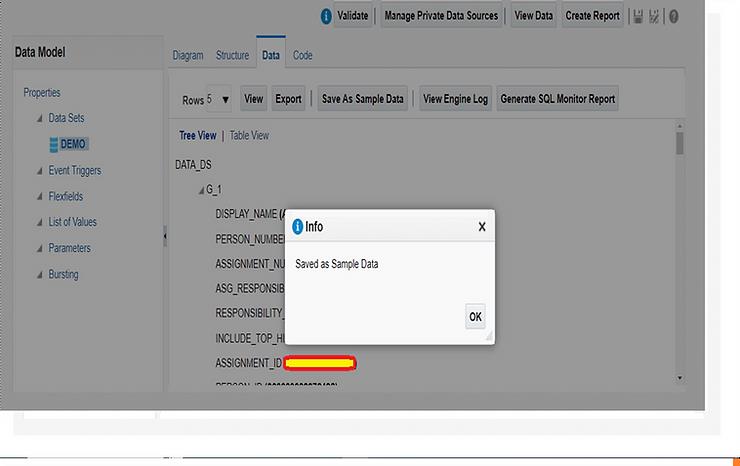
- First, we need to save the data has a Save as Sample Data
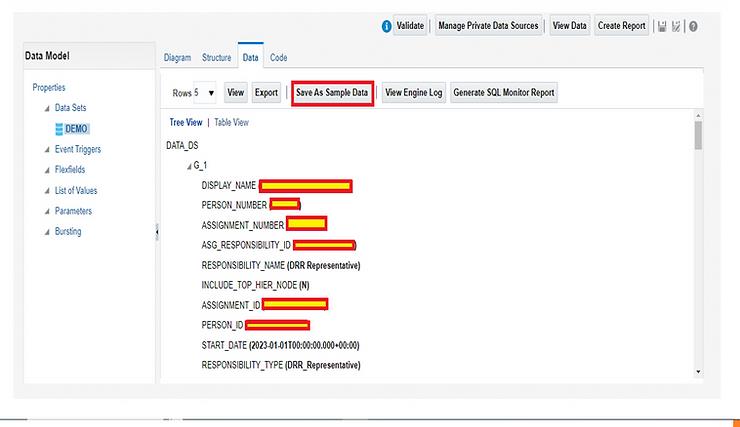
- Once we can click on Save as Sample Data, we will get confirmation message. And click on ok button.
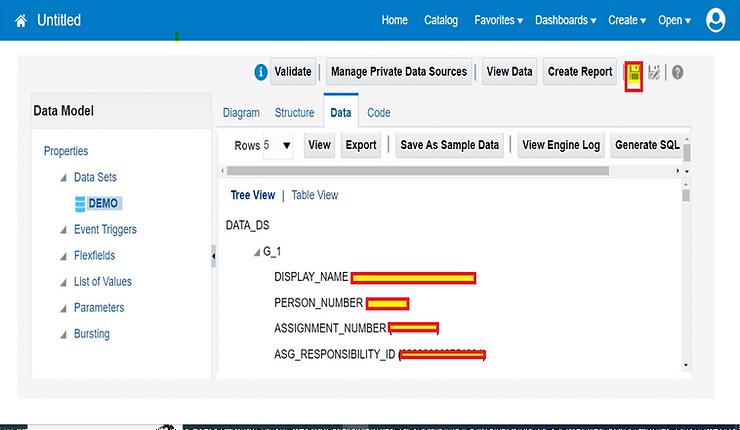
- We can click on save symbol.
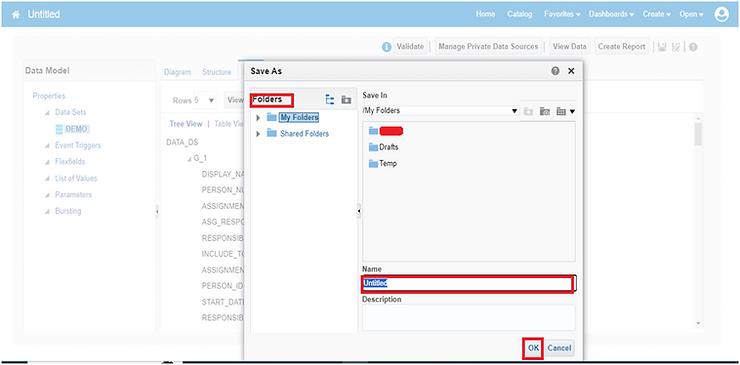
- Select the folder where you want to save data model, Enter the data model name and click on ok button.
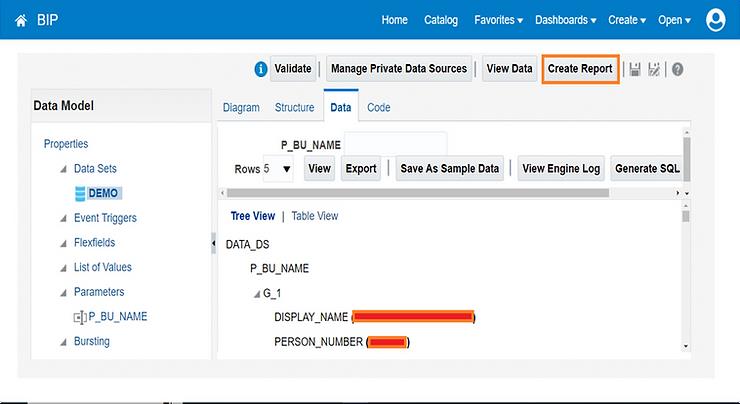
- Click on Create Report.
- Use the Report editor to Click on Finish button.
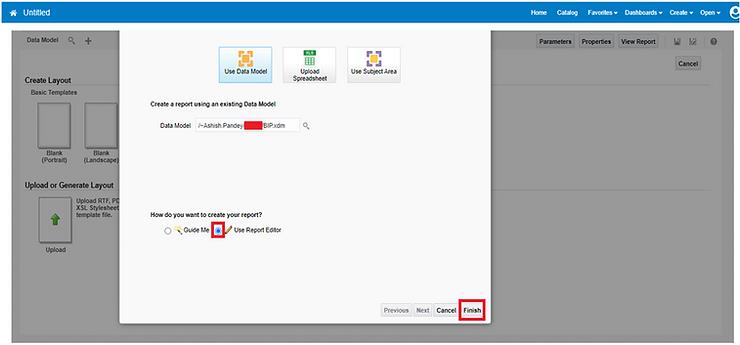
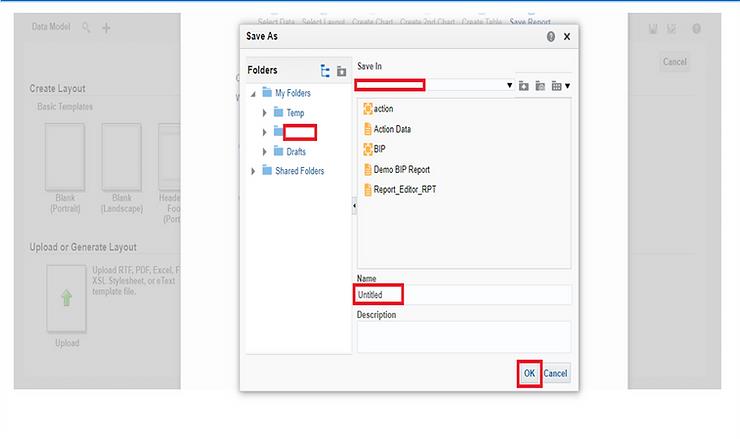
- Save the report and click on ok button.
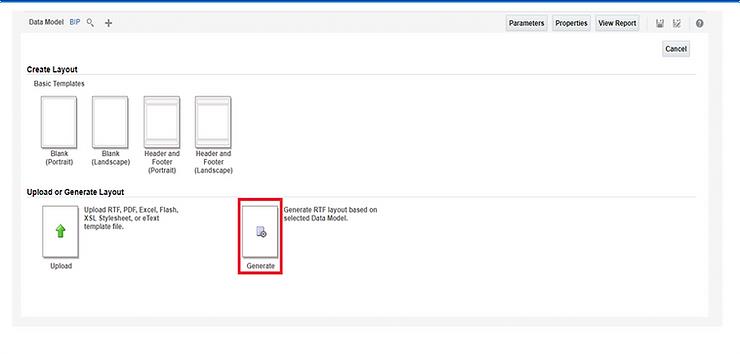
- Click on Generate RTF layout based on selected Data Model.
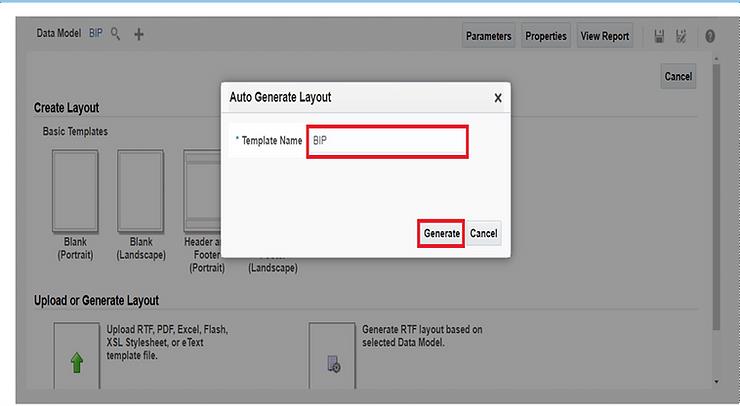
- Write a Data model Name And Click on Generate.
- Click on View Report.
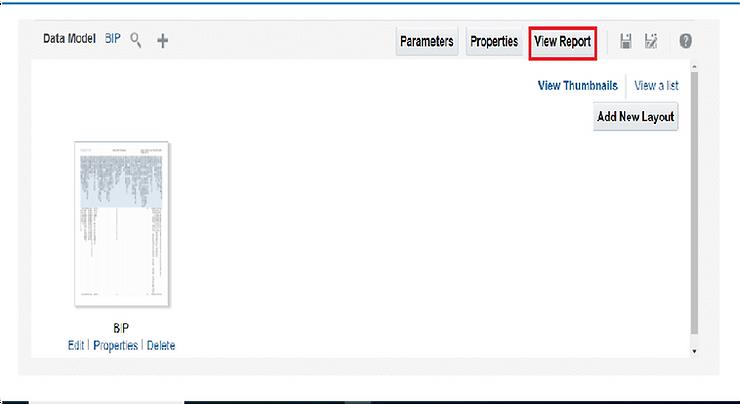
- Report is display like this. If we want we can view this report or Download print and different type of view report.
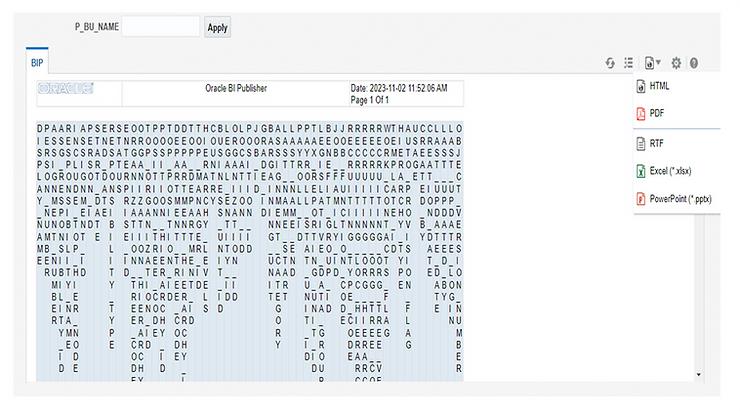
- Both Data Model and Report are created successfully.
- First is data model.
- Second is BIP Report.
 Conclusion
BI reports play a crucial role in modern business strategy, enabling organizations to leverage data for smarter decision-making. By adopting BI tools and best practices, companies can enhance efficiency, improve financial performance, and stay ahead in the competitive market.


